Wazuh
The Wazuh manager on security-01, the 15 agents that report to it, what each agent group watches, and the two independent ways it decides a file is malicious.
Wazuh is the endpoint half of my detection stack. Every Proxmox node and almost every running Linux guest carries an agent, the manager turns what they report into alerts, and those alerts are forwarded to Splunk, which is the only thing that notifies anyone. Wazuh itself stays detection only.
At a glance
| Item | Value |
|---|---|
| Manager | Wazuh 4.14.8, all-in-one install (manager, indexer and dashboard), packages 4.14.8-1 since 2026-10-02 |
| Host | VM 200 security-01 on grey-server, Ubuntu 24.04.4 LTS, 4 vCPU, 10 GiB memory with an 8 GiB balloon floor, 100 GiB on ssd-lvm1 |
| Network | Security-A, VLAN 72 |
| Agents | 15 remote agents plus the manager’s own agent 000, all active on 2026-10-02 |
| Agent packages | 14 agents on 4.14.6-1 and edge-01 on 4.14.5-1, last recorded 2026-09-06; holds in place |
| Agent groups | default on every agent, plus proxmox, edge and workstation |
| Detection | File integrity monitoring per group, local rule 100200 against a weekly MalwareBazaar hash list, and the VirusTotal integration |
| Response | None. Wazuh is detection only by decision |
| Forwarding | A Splunk Universal Forwarder on security-01 ships the alert stream to splunk-siem, index wazuh, 30 days retention |
| Notification | Four Splunk saved searches over Wazuh data post to Discord (Splunk) |
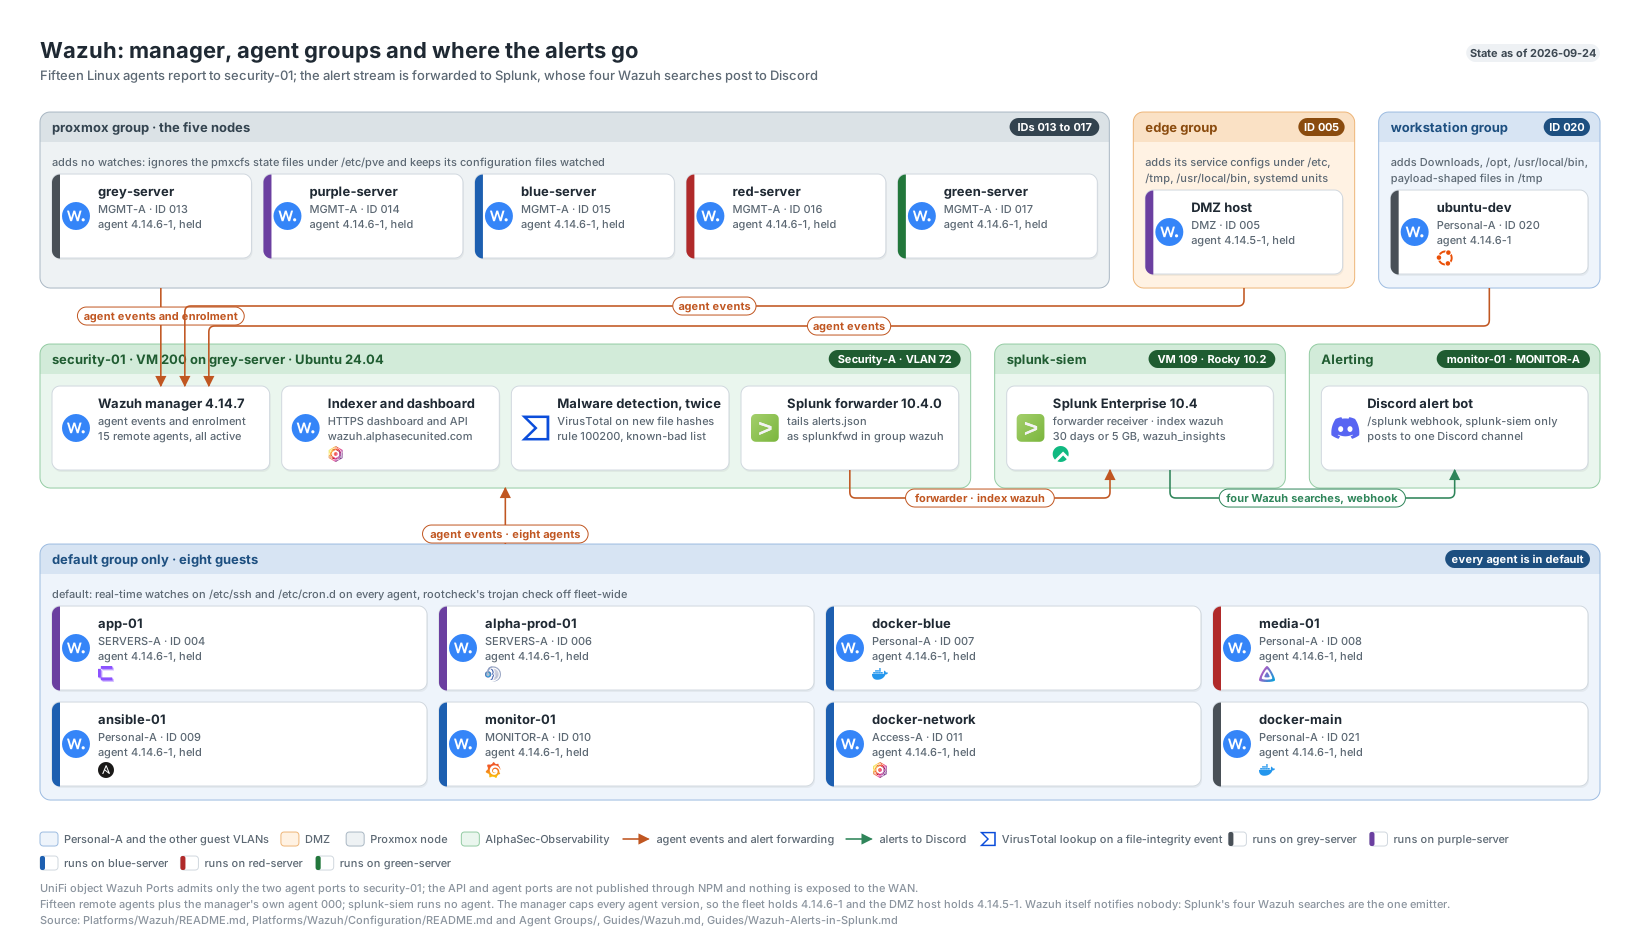
The Wazuh manager, the agent groups and where the alerts go, from the repository’s diagram set. Click to enlarge.
The agent fleet
On 2026-10-02 wazuh-control info reported v4.14.8 and agent_control -l listed 15 agents plus the manager, all active. Every Proxmox node and every running Linux guest carries an agent except splunk-siem, which has none. kali-pen is stopped and not enrolled, and there are no Windows agents.
| Host | Agent ID | Groups | What it is |
|---|---|---|---|
grey-server | 013 | default, proxmox | Proxmox node, runs security-01 and splunk-siem |
purple-server | 014 | default, proxmox | Proxmox node |
blue-server | 015 | default, proxmox | Proxmox node |
red-server | 016 | default, proxmox | Proxmox node |
green-server | 017 | default, proxmox | Proxmox node |
app-01 | 004 | default | Application server, VM 116 |
edge-01 | 005 | default, edge | DMZ host on VLAN 30 |
alpha-prod-01 | 006 | default | Production Docker host (TeamSpeak) |
docker-blue | 007 | default | Docker host, CT 108 |
media-01 | 008 | default | Media stack LXC |
ansible-01 | 009 | default | Ansible control node |
monitor-01 | 010 | default | Prometheus and Grafana, CT 104 |
docker-network | 011 | default | Reverse proxy and NetBird host, CT 107 |
ubuntu-dev | 020 | default, workstation | The workstation I sit at |
docker-main | 021 | default | Docker host, CT 110 |
Retired identities stay retired. I removed the stale IDs 002 and 003 on 2026-07-13, debian-dev (019) on 2026-08-14, the Kasm identity 012 on 2026-08-19 after destroying its VM, and game-01 (018) on 2026-09-12. A retired endpoint is never restored from an old client.keys; it is reinstalled and enrolled under a fresh exact-name identity.
How agents are deployed
The 2026-08-03 deployment installed twelve agents from one Ansible project, Source/agent-deployment, run from ansible-01 on 2026-08-03. The play:
- stops before touching packages if the host cannot reach both manager agent ports,
- installs
wazuh-agentpinned to 4.14.6-1 from the Wazuh 4.x APT repository, - enrolls with the exact inventory hostname, into
default,proxmoxfor the five nodes anddefaultfor everything else, - starts the service and polls
systemctl is-activefor up to 60 seconds, - confirms a non-empty
client.keys, holds the package and disables the repository.
Two of those steps exist because the first runs failed. A task that cleared a package hold before installation failed because dpkg_selections cannot clear a hold on a package APT has not indexed, so I removed it. And an immediate service_facts assertion reported freshly started agents as stopped even though they already had keys and sessions; the explicit is-active poll replaced it, and the four Proxmox nodes in that run each needed two poll retries, which reproduced the race and proved the fix. The final runs returned changed=0.
Why every agent is held
An agent must never be newer than its manager, and the Wazuh repository only publishes the current package for a release line, not a back catalogue. On 2026-08-04 the repository carried only 4.14.7-1 while the manager still ran 4.14.6-1, so the only version an agent could install was the one it must not install. app-01 had the repository with no hold, and a simulated fleet run showed the next ordinary package run would have pushed it past the manager. Holding it was the fix. A source plus a hold is the whole of what an agent can safely have until the manager moves.
The audit on 2026-09-06 found the outage that the version table had hidden: docker-main ran agent 4.14.0-1 pointed at the manager’s address from before the Security-A migration, and had never connected to the current manager. I upgraded it to 4.14.6-1, corrected the one address line, re-enrolled it as ID 021, held it, disabled its repository and added it to the Ansible inventory. A limited play run returned ok=15 changed=0, which is the check that the host matches what the automation would build.
File integrity monitoring
Groups are the unit of configuration, and putting a machine in its own group is what makes it safe to give that group aggressive settings. All four group fragments are versioned under Configuration/Agent Groups.
| Group | Members | What it watches |
|---|---|---|
default | All 15 agents | /etc/ssh and /etc/cron.d in realtime with report_changes, a full scan every six hours, alerts on new files. Turns off rootcheck’s trojan check and ignores /dev/.lxc |
edge | edge-01 | Its two service configuration directories, /tmp, /var/tmp, /usr/local/bin, the administrator’s .ssh and /etc/systemd/system, all realtime. Editor swap and .tmp files ignored |
proxmox | The five nodes | No new watches. Only ignores for the parts of /etc/pve that are cluster state |
workstation | ubuntu-dev | ~/Downloads, /tmp and /var/tmp restricted by filename, /usr/local/bin, /opt, ~/.ssh, ~/.config/systemd/user and /etc/systemd/system, all realtime |
The workstation group exists because ubuntu-dev is the one machine where a file arrives because a person chose to download it. That makes it the first place to widen monitoring and the only place a VirusTotal lookup has something to look up. The edge group exists because edge-01 sits in the DMZ, the most exposed network in the lab.
The scratch-directory lesson
The first version of the workstation group watched all of /tmp. In one day the feed looked like this:
| Directory | Alerts | What it is |
|---|---|---|
A tooling working directory under /tmp | 2,334 | Scratch files from my own tools |
/tmp/scoped_dir<random> | 124 | Browser scratch |
/tmp/<reverse-dns>.<random> | 60 | Desktop application session state |
/etc/lvm on grey-server | 198 | A real change, from my own LVM work |
/etc/pve across five nodes | 133 | Proxmox cluster state |
Roughly 97 per cent of it was the machine describing its own housekeeping, and the noise was not merely untidy. Every one of those files was submitted to VirusTotal, and the integration answered 2,697 lookups in one day with “Public API request rate limit reached”. The noise consumed the daily quota, so the one thing the group exists to catch would have been refused a verdict. A monitor that disables the detection it feeds is worse than no monitor.
/tmp is still watched, because a payload dropped into world-writable space is a real case. It is now restricted by filename, so a script, an executable, an archive or a package is worth a hash and a lookup and a browser’s cookie file is not:
<directories check_all="yes" realtime="yes"
  restrict="\.sh$|\.bash$|\.py$|\.pl$|\.rb$|\.php$|\.elf$|\.bin$|\.run$|\.out$|\.so$|\.ko$|\.exe$|\.dll$|\.ps1$|\.jar$|\.deb$|\.rpm$|\.appimage$|\.zip$|\.tar$|\.tgz$|\.gz$|\.bz2$|\.xz$|\.7z$|\.rar$|\.iso$">/tmp</directories>
The ignore list matches by shape rather than by product. Desktop applications name their /tmp working directories after their own bundle identifier, so two expressions cover all of them, the list never needs maintaining per application, and no vendor name ends up in an alert that might land in a screenshot:
<ignore type="sregex">/tmp/\w+\.\w+\.\w+\.</ignore>
<ignore type="sregex">/tmp/\.\w+\.\w+\.\w+\.</ignore>
Note: Wazuh’s
sregexis not PCRE. It takes\w,\d,\s,\.,+,*,^,$and|, and has no?, no{}and no character classes, so an expression that works ingrep -Ecan silently match nothing.
Two more groups corrected for the same reason
The proxmox group had no configuration at all, so /etc/pve was caught by Wazuh’s stock /etc watch. On a Proxmox node /etc/pve is pmxcfs, a FUSE filesystem backed by the cluster database, and the cluster rewrites its status files every few seconds. Each of .rrd, .version, ha/crm_commands, ha/manager_status and each node’s lrm_status reported 533 changes, and five nodes doing that produced 5,570 alerts of nothing. The group now ignores the state files, the rotating authkey.key and the 76pveproxy file rewritten on every pveproxy restart, and leaves the configuration watched: corosync.conf, storage.cfg, user.cfg, the firewall rules and the guest definitions.
The default group turned off rootcheck’s trojan check fleet-wide. It works by grepping system binaries for strings a trojaned copy might contain, and on Debian the ordinary setuid binaries contain them:
| File | Alerts |
|---|---|
/bin/chfn | 1,046 |
/bin/chsh | 1,043 |
/bin/passwd | 1,040 |
/usr/bin/chsh | 1,039 |
/usr/bin/passwd | 1,039 |
/usr/bin/chfn | 1,029 |
That was over 22,000 “Trojaned version of file detected” alerts and not one real finding. A check with a hundred per cent false-positive rate is the noise every real alert has to be found inside. Nothing is left uncovered: a modified system binary still shows as a file-integrity change, and a malicious file is caught by its hash. check_dev stays on, because a file hidden under /dev is a real technique.
<rootcheck>
  <check_trojans>no</check_trojans>
  <ignore>/dev/.lxc</ignore>
</rootcheck>
After both corrections, file-integrity alerts across the fleet went from 2,958 in 24 hours to 227, and the trojan false positives went from 22,190 to zero.
Validate before install
My first attempt used set -e with install ahead of the check, so a broken file was already live by the time anything looked at it. The break was a double hyphen inside an XML comment, which is illegal, and I had written it twice. The order is now an XML parse locally, the same parse on the staged file on the manager, then install, then:
/var/ossec/bin/verify-agent-confThat returns OK per group, and it is the only check that reads the file the way the manager will.
Malware detection
I gave Wazuh two independent ways to decide a file is malicious. Both fire on a file-integrity event, so a file has to appear or change before either runs.
VirusTotal, and its quota
The VirusTotal integration lives in ossec.conf on the manager, triggered by the syscheck group. It is not versioned, because the stanza is mostly its API key.
<integration>
  <name>virustotal</name>
  <api_key><REDACTED></api_key>
  <group>syscheck</group>
  <alert_format>json</alert_format>
</integration>
The free tier answers 500 lookups a day and 4 a minute, and past either ceiling it returns an error instead of a verdict. An unanswered lookup looks exactly like a clean one, which is the failure mode worth designing against. When the quota ran out, wazuh-integratord returned exit 4, ERR_NO_RESPONSE_VT, which reads like the service is unreachable. I diagnosed it as a key or egress problem first. It was neither: both API versions returned HTTP 200 from the manager and a direct EICAR lookup came back with 65 positives. The cause was in integrations.log, nine times over.
The local known-bad hash list
The second mechanism is a Wazuh CDB list, etc/lists/known-bad-hashes, which analysisd compiles into a local hash lookup. It costs no network call and cannot be rate limited. Rule 100200 checks every new or changed file against it:
<group name="malware,known_bad_hash,">
  <rule id="100200" level="12">
    <if_sid>554,550</if_sid>
    <list field="sha256" lookup="match_key">etc/lists/known-bad-hashes</list>
    <description>Known-bad file hash found: $(file)</description>
    <mitre>
      <id>T1105</id>
    </mitre>
  </rule>
</group>
Rule 554 is a new file and 550 is a watched file changing, so the rule sees both a download and an overwrite. Level 12 puts a match in the high band, where Wazuh’s own scale turns from unusual to attack. My first description read Known-bad file hash found on $(agent.name): $(file) and produced found on : /path, because only decoded fields interpolate into a description and the agent name is alert metadata. The agent is a column everywhere the alert is shown, so the description dropped it.
The weekly refresh
The list is rebuilt by /usr/local/sbin/wazuh-refresh-hash-list, run by a oneshot service and a timer, all versioned under Scripts.
[Timer]
OnCalendar=Sun 04:30
Persistent=true
RandomizedDelaySec=30m
Each run:
- Writes the EICAR test hash as the first line, permanently. EICAR is the standard harmless antivirus test string, and pinning it means the whole path (file appears, syscheck hashes it, the rule matches, the alert reaches Splunk) can be proven on demand without going near real malware.
- Downloads the abuse.ch MalwareBazaar feed of SHA-256 hashes from the last 48 hours, strips quotes and carriage returns, keeps only 64-character hex lines, lowercases, de-duplicates and appends each as
hash:malwarebazaar. The recent feed is deliberately small: a full dump is millions of hashes and would cost more analysisd memory than it is worth, and recent samples are the ones a fresh download is likely to match. - Refuses to install the list if it has fewer than 2 entries, so a feed that returns nothing cannot quietly empty the detection.
- Installs the list owned by the
wazuhgroup and restarts the manager, because analysisd compiles a CDB list only at startup.
printf '%s\n' "275a021bbfb6489e54d471899f7db9d1663fc695ec2fe2a2c4538aabf651fd0f:eicar-test-file" > "$TMP"

curl -sfL --max-time 120 "https://bazaar.abuse.ch/export/txt/sha256/recent/" \
  | tr -d '"\r' \
  | grep -Eio '^[a-f0-9]{64}$' \
  | tr 'A-F' 'a-f' \
  | sort -u \
  | sed 's/$/:malwarebazaar/' >> "$TMP"

COUNT=$(wc -l < "$TMP")
if [ "$COUNT" -lt 2 ]; then
  echo "refusing to install a list with $COUNT entries" >&2
  exit 1
fi

install -o wazuh -g wazuh -m 660 "$TMP" /var/ossec/etc/lists/known-bad-hashes
systemctl restart wazuh-manager.service
systemctl is-active --quiet wazuh-manager.service
The list held 872 entries on 2026-08-31, and the run on 2026-09-06 rebuilt 730.
Three things about this did not work the way I expected:
wazuh-makelistsdoes not exist in 4.14 and returns exit 127. A manager restart is what publishes a changed list.- I wrote the timer and never enabled it. Writing a unit file is not enabling it, and
daemon-reloadenables nothing. It sat disabled for two days until I checked the record against the host. A stale list still matches EICAR on demand, so the one test I would have run to check the mechanism would have passed for a year. - The refresh originally restarted the manager with
wazuh-control restartfrom inside its own oneshot service. The new manager processes were children of that service, so systemd killed them when it exited, whilewazuh-manager.servicekept reporting active. The manager was down from 2026-09-06 to 2026-09-11. The script now restarts through systemd and checks the unit afterwards; the full account is on the incidents page.
Warning: A service that restarts another daemon must go through
systemctl, not the daemon’s own control script. Anything started directly lives in the calling unit’s cgroup and dies with it.
The end-to-end test
On 2026-08-30 I wrote the EICAR test string into ~/Downloads on ubuntu-dev, a directory the workstation group watches in realtime, and let the chain run untouched. Both mechanisms fired, one second apart, on the same file:
| Time | Rule | Level | What it said |
|---|---|---|---|
| 10:46:56 | 87105 | 12 | VirusTotal: 64 of 67 engines detected this file |
| 10:46:57 | 100200 | 12 | Known-bad file hash found: the test file’s path |
They are genuinely independent. 87105 is a network lookup answered by VirusTotal, and 100200 is a local comparison that would have produced the same result with the Internet unplugged. Both were searchable in Splunk about ten seconds later.
The same test had been refused a verdict earlier that day. It succeeded only after the workstation group stopped submitting scratch files, which is the clearest evidence that the file-integrity correction was a prerequisite and not housekeeping. I had also deleted my first successful verdict: when I purged the scratch-file alerts, the first test file had been written under /tmp, and a purge scoped by path takes the true positives in that path too.
Active response
There is none, and that is a decision rather than a gap. I considered active response while planning the alerts on 2026-09-02 and chose to keep Wazuh as detection only. Nothing quarantines or deletes a file that matched a known-bad hash. I will revisit it only if a detection ever arrives that a person could not have acted on in time.
Rules and decoders
The customized detection content is small on purpose:
| Item | Where | Notes |
|---|---|---|
| Rule 100200 | etc/rules/local_rules.xml, versioned | Known-bad hash match, level 12, MITRE T1105 |
| Rule 100001 | Same file | The stock example that ships with Wazuh, left alone so it is clear what was authored here |
known-bad-hashes | etc/lists/, rebuilt weekly | The CDB list rule 100200 reads |
| VirusTotal stanza | ossec.conf, not versioned | Triggered by the syscheck group |
| Agent group fragments | etc/shared/<group>/agent.conf, versioned | The four groups above |
There are no custom decoders. Wazuh’s package-owned audit signatures are unchanged. The old custom default group entry for a WordPress volume path, absent on every host, was removed on 2026-08-03 along with its rollback copy.
Upgrade history
| Date | Change |
|---|---|
| 2026-07-13 | Purged the old agents on app-01 (4.14.5-1) and edge-01 (4.10.3-1), removed stale manager IDs 002 and 003, and enrolled both fresh at 4.14.5-1 as IDs 004 and 005 |
| 2026-08-03 | Deployed twelve agents at 4.14.6-1 with Ansible, IDs 006 to 017, and created the proxmox group |
| 2026-08-04 | Added the Wazuh package source to edge-01 with a hold at 4.14.5-1, held app-01, and upgraded the central stack from 4.14.6-1 to 4.14.7-1 |
| 2026-09-06 | Re-enrolled docker-main from 4.14.0-1 to 4.14.6-1 as ID 021 |
| 2026-10-02 | Upgraded the central stack to 4.14.8-1 during the guest package updates; all 15 agents active afterwards |
The 4.14.7 upgrade went component by component with a stop-and-assess gate after the indexer. I copied the indexer configuration, ossec.conf and the Filebeat configuration aside first. Filebeat and the dashboard came down, the indexer security configuration was exported, shard allocation dropped to primaries, and a flush committed 399 of 399 shards before the manager stopped. The indexer package came back green in ten seconds with the same 400 primary shards and no outdated plugins across 17, which passed the gate. The manager followed with the Wazuh Filebeat module 0.5 and the v4.14.7 alerts template, then the dashboard, which answered within ten seconds. Agents stayed at 15 active and zero disconnected before and after.
Two lessons came out of it. I authenticated to the indexer API with the admin certificate already on the host instead of a password, so nothing secret went near a command line. And I kept the existing configuration files: the packaged opensearch_dashboards.yml points at certificate file names this install does not have, so adopting it wholesale, as the vendor procedure suggests, would have left the dashboard unable to start.
Health checks
systemctl is-active wazuh-manager wazuh-indexer wazuh-dashboard
sudo /var/ossec/bin/agent_control -l
sudo /var/ossec/bin/agent_groups -S -i <agent-id>
A healthy dashboard answers an unauthenticated request with HTTP 302 and the API with 401. Recovery brings the indexer up first, then the manager, then the dashboard, then checks the listeners and confirms the expected 15 agents with agent_control -l. A failed local service is never fixed by weakening a firewall policy.
Open work
- Add a manager API or process and listener health check. The manager unit stayed active for five days while its daemons were gone, so service state alone is not enough.
- Decide whether
splunk-siemgets an agent. It is the only running Linux guest without one. - Phase two of file integrity monitoring: the other 13 agents still carry only
/etc/sshand/etc/cron.d, so the hash list and VirusTotal have nothing to look at on them. - Release the agent holds one host at a time now that the manager is newer than every agent, and move
edge-01off 4.14.5-1. openipmi.serviceis failed onred-serverand raises alerts, and rootcheck still reports 36 “Files hidden inside directory ‘/tmp’” events onubuntu-devfrom desktop application dot-directories.
How these alerts are searched, mapped and turned into Discord messages is on the Splunk page.